

Displaying the Custom Pivot Report (BI)
Last updated:
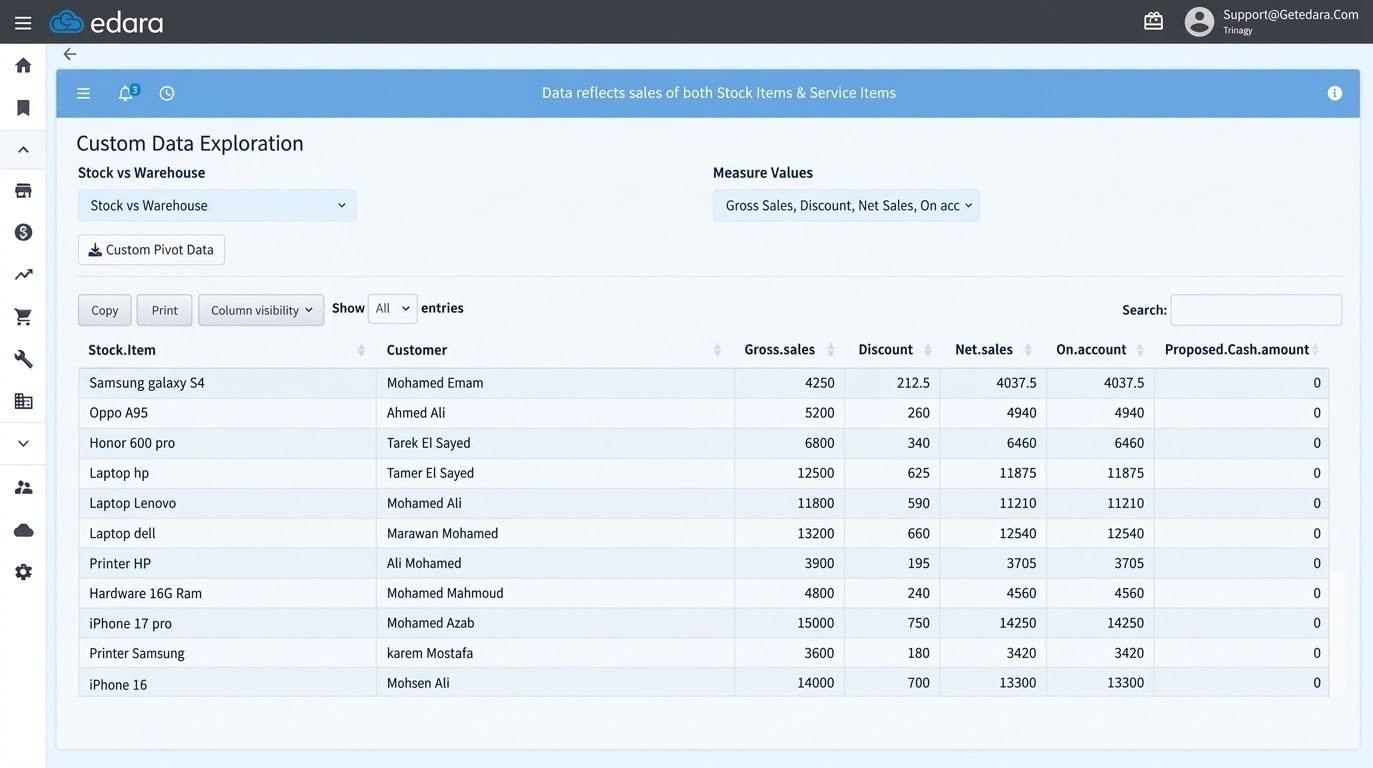
Custom reports in Business Intelligence allow you to view sales order details, including the payment method, gross profit, and cost, on the same line, helping you analyze sales and collection data more clearly.
Through these reports, you can analyze performance from different perspectives, such as tracking sales by customer, item, or payment method, and comparing net sales to gross profit, without relying on multiple reports or exporting data to external files.
Displaying the Custom Pivot Report (BI)
- Go to the “BI” module.
- Open the “Gross Profit” page.
- Go to the “Data Pivots”.
- Go to the “Custom Pivot” section.
- Select the required time period.
- Select Grouping Levels, such as:
Year – Month – Day – Date – Country – City – Stock Item – Classification – ClassificationL1 – ClassificationL2 – ClassificationL3 – ClassificationL4 – Stock Item – Service Item – Item Code – SalesPerson – Brand Name – Sales Document Code – Detail ID – Workorder Code – Customer – Sales Store – Warehouse – Workorder Type – Document Type
- Select Measurements, such as:
Price – Gross Sales – Sales Return – Discount – Net Sales – COGS – VAT – On Account – Proposed – Cash Amount – Sales Volume – Gross Profit – Gross Profit % – GrossCostAverageCost – GrossCostFIFO – GrossCostLastCost – GrossCostLIFO – GrossProfitAverageCost – GrossProfitFIFO – GrossProfitLIFO
The results will be displayed instantly based on the options you selected.
If you encounter any challenges or have questions during these processes, you can contact our technical support team, who are ready to assist you at any time.